

Recent analysis of data on housing prices in Oxford reveals that price changes have been unpredictable and uneven. This raises concerns and makes people question whether purchasing a house in one of England’s most historic and expensive cities is really worth it.

7 Reasons to study in Oxford | unite students. (2025). Unitestudents.Com. https://www.unitestudents.com/the-common-room/category/student-living/7-reasons-to-study-in-oxford
The housing market can feel overwhelming for anyone looking to purchase a home in Oxford. It almost feels as if it were a moving target. Prices fluctuate very often. They rise, then they fall, then they rise again, causing potential challenges when looking at how much one needs to save for a down payment. A recent analysis of data examining house pricing in Oxford from 2019 onwards suggests that despite the housing market having seen times of decline, the annual price growth has predominantly been positive.
The recent numbers display that the market has not had a steady growth. Calculations based on the dataset revealed that the average year-on-year change of house prices in Oxford across the time period analysed was 1.86%. June 2021 saw the greatest annual gain with 11.84%, while April 2021 experienced the biggest decline with 4.54%. These varied figures highlight how vital it is to look further than the average to understand how the market has developed over time.
A wider concern is also raised by the findings. What do house price fluctuations entail for the people residing in Oxford who are trying to afford to buy a home?
A city where affordable housing remains a challenge.
Oxford is famously recognised for its universities, research facilities, and architecture and landmarks. For many citizens, however, the housing market is a huge hurdle.
As reported by the Oxford City Council, living in Oxford ranks among one of the most expensive cities in the country. According to the GOV.UK House Price Index for the most recent recorded month, which was May 2026, the average house price is £473,467. Roughly 10 times the average local household income. https://www.gov.uk/government/statistics/uk-house-price-index-for-may-2026/uk-house-price-index-england-may-2026
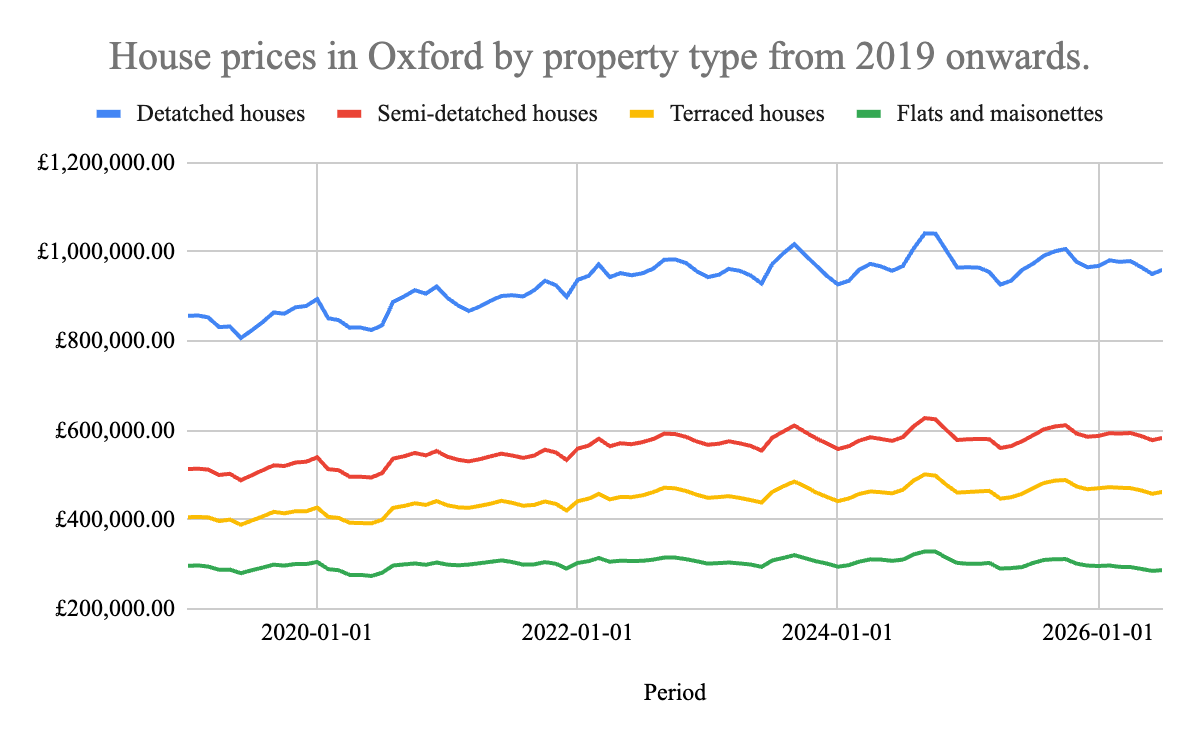
Based on the analysis, the average price, across all property types, saw a rise of £40,521 (9.4%) from £431,146 in January 2019 to £471,667 in the most recent recorded month.
The total figure, however, blurs the differences between the different types of property. The cost of terraced homes saw a percentage increase of £14% from £405,478 to £462,227. Detached homes went up by 12.05% from £856, 673 to £959,933, and finally, semi-detached homes also increased, with a rise of 13.63% from £513,248 to £583,213.
Even though detached houses continue to become far more expensive, this analysis demonstrates that terraced homes experienced the biggest percentage increase across the different property types examined.
Varied price pressures, different homes.
When evaluating the Oxford housing market, it is essential to distinguish between percentage increase and price levels. While detached homes have the greatest average price in the dataset, their percentage rise has been lower than that of terraced homes.
This indicates that the type of property being evaluated could have a major effect on the financial challenge of entering the market for prospective buyers. One housing category could result in a percentage increase, but another category may require more money up front due to its higher starting price.
The findings also show why just one single city-wide average might not give the most complete or accurate representation. Though pricing averages in the real-estate industry help determine general patterns or trends in a fluctuating market, they fail to reflect shifts in pricing of individual homes. A fuller overview of these variations can be achieved by independently assessing the different property types in the market.
Still, typical costs should not be regarded as an indicator of what each or every customer is willing to pay. Rather than being evaluations of specific or individual properties, they are simply broader indicators of the housing market. In addition, the numbers are not indicative of whether every household has faced the same financial challenges.
Rising costs don’t entirely reflect affordability.
The deeper issue when it comes to housing affordability in Oxford involves more than just shifts in property prices. People who earn lower salaries or don’t have as many savings could still find it challenging to purchase a property, even if the price increase is slow and gradual.
There are other factors that play a key role in the lack of affordability beyond the purchase price. Some of these factors include higher taxes, the cost of mortgages, household incomes and deposit/down payment requirements. Despite the UK house price index demonstrating shifts in prices, it is not able to, on its own, determine if property prices have grown to be more affordable for the residents of Oxford.
What the data can and cannot demonstrate.
The analysis uses the UK house price index data, which offers a reliable set of data that helps compare the average price of different property types over time. This dataset is useful because it assesses the change in price monthly, as opposed to yearly.
The numbers analysed provide a key distinction. Just one average price is not enough information to analyse or understand the Oxford housing market. When assessing the limitations faced by potential buyers, it matters to consider the different types of property available in Oxford, the rate of price growth for these different types of property, and the patterns/correlation between local salaries and rising prices.
Despite the data highlighting how different house types and prices have changed since 2019, examining more closely how the incomes of residents, and what this permits them to afford, is crucial in order to accurately determine whether or not Oxford has become more affordable or more expensive.