


The UK housing market is constantly under scrutiny, but why? Buying a house in this market is not simple. Prices are varying, cost-of-living is increasing, and the unpredictability of regional housing markets is confusing.
Data from the House of Commons Library shows that current median house prices in the UK are constantly changing. However, we know looking at a dataset can be overwhelming. When analysing deeper into the data, house prices are shown as having a vary of fluctuations throughout UK parliament constituencies. Determining which of the 650 UK constituencies you want to settle down in, can be more unsettling than you think.
It is interesting to see when and where constituencies face challenges, and whether these challenges are short-term, or a long-term problem. Exploring where these issues are, and establishing where they are geographically, can tell us a story.
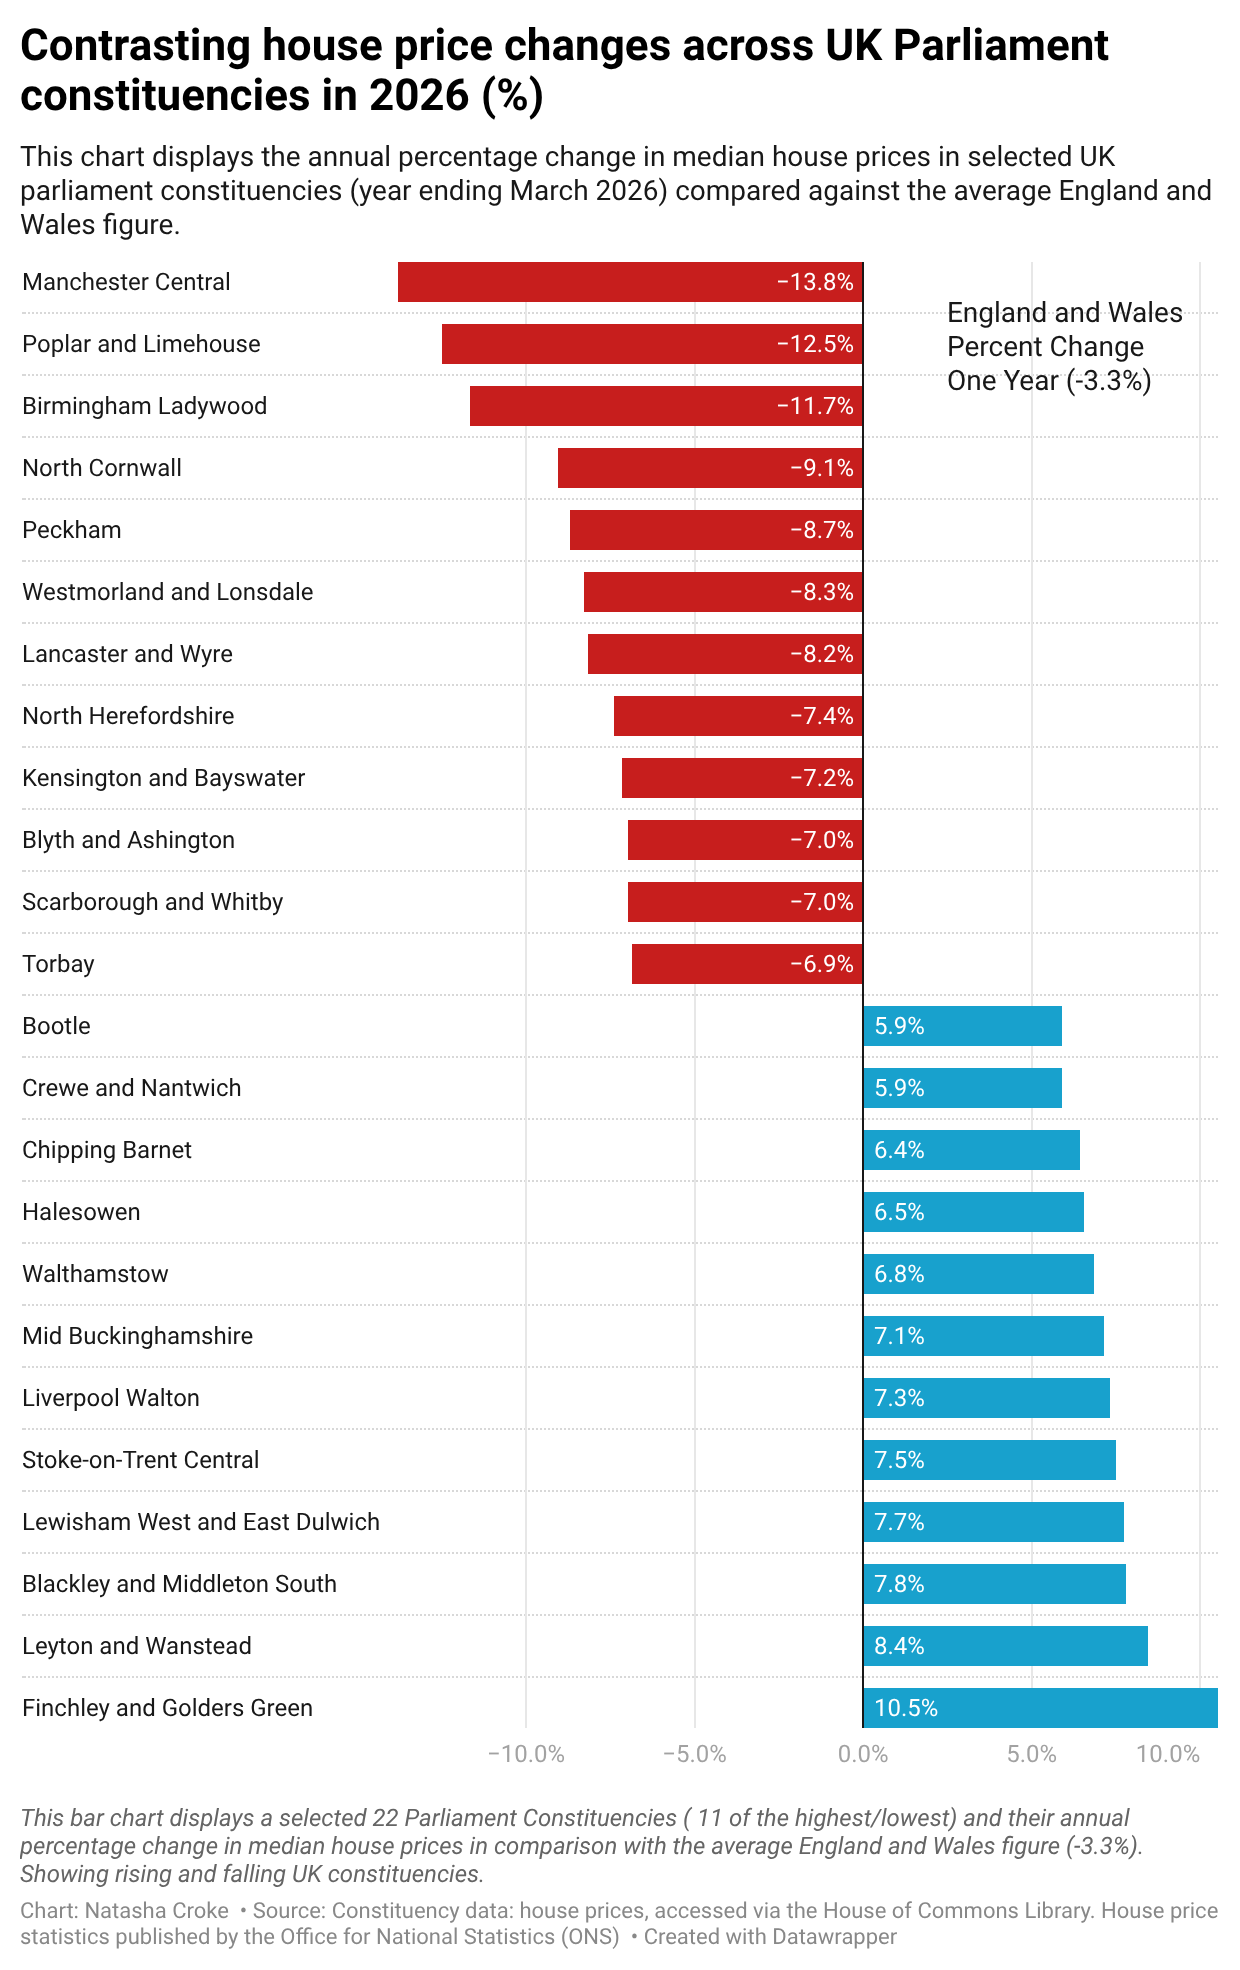
The graph below shows the highest 11, and lowest 11 constituency percentage changes in one year (2026), and compares them against the England and Wales median change of -3.3%. The variation in house prices across contituencies is staggering despite their geographical proximities falling in the same broader region, the individual constituencies perform differently. Finchley an Golders Green recorded an increase in prices, of 10.5%, while Kensington and Bayswater records a drop of -7.2%, despite being in the same region of Greater London.
Why might this be?
Higher demand in certain constituencies equates to a higher housing market. Due to the cost-of-living, areas such as Kensington and Bayswater are seen as being highly unattainable for the average person. Entry level housing prices start at around £1/2 million +, while Finchley and Golders Greens house prices start at around £600k+. Finchley and Golders Green is also Zone 3. Being more family friendly, this is an enviroment families can purchase a house, rather than a flat in a higher zone area, increasing desirability and therby price.
The region of the North West is experiencing the same, with Manchester Central facing the biggest decline across the UK Constituencies, of -13.8% in 2026. On the contrary, Liverpool Walton faces an increase of 7.3%. Other figures in the North West solidify how different the housing market is, regarless of the region. Blackley and Middleton South (7.8%) and Westmorland and Lonsdale (-8.3%) is another example of this, emphisisng how despite the regional average can seemingly be positive (or negative) local Constatiencies mask significant variants in the local and individual housing market.
While the graph above shows the most up to date information, house prices in 2026 rising and falling, the graph below shows a slightly more interesting story; the latest annual change compared against the cumulative five-year change (the difference displayed below in percentage points).
What has happened this year in comparison with the past five years?
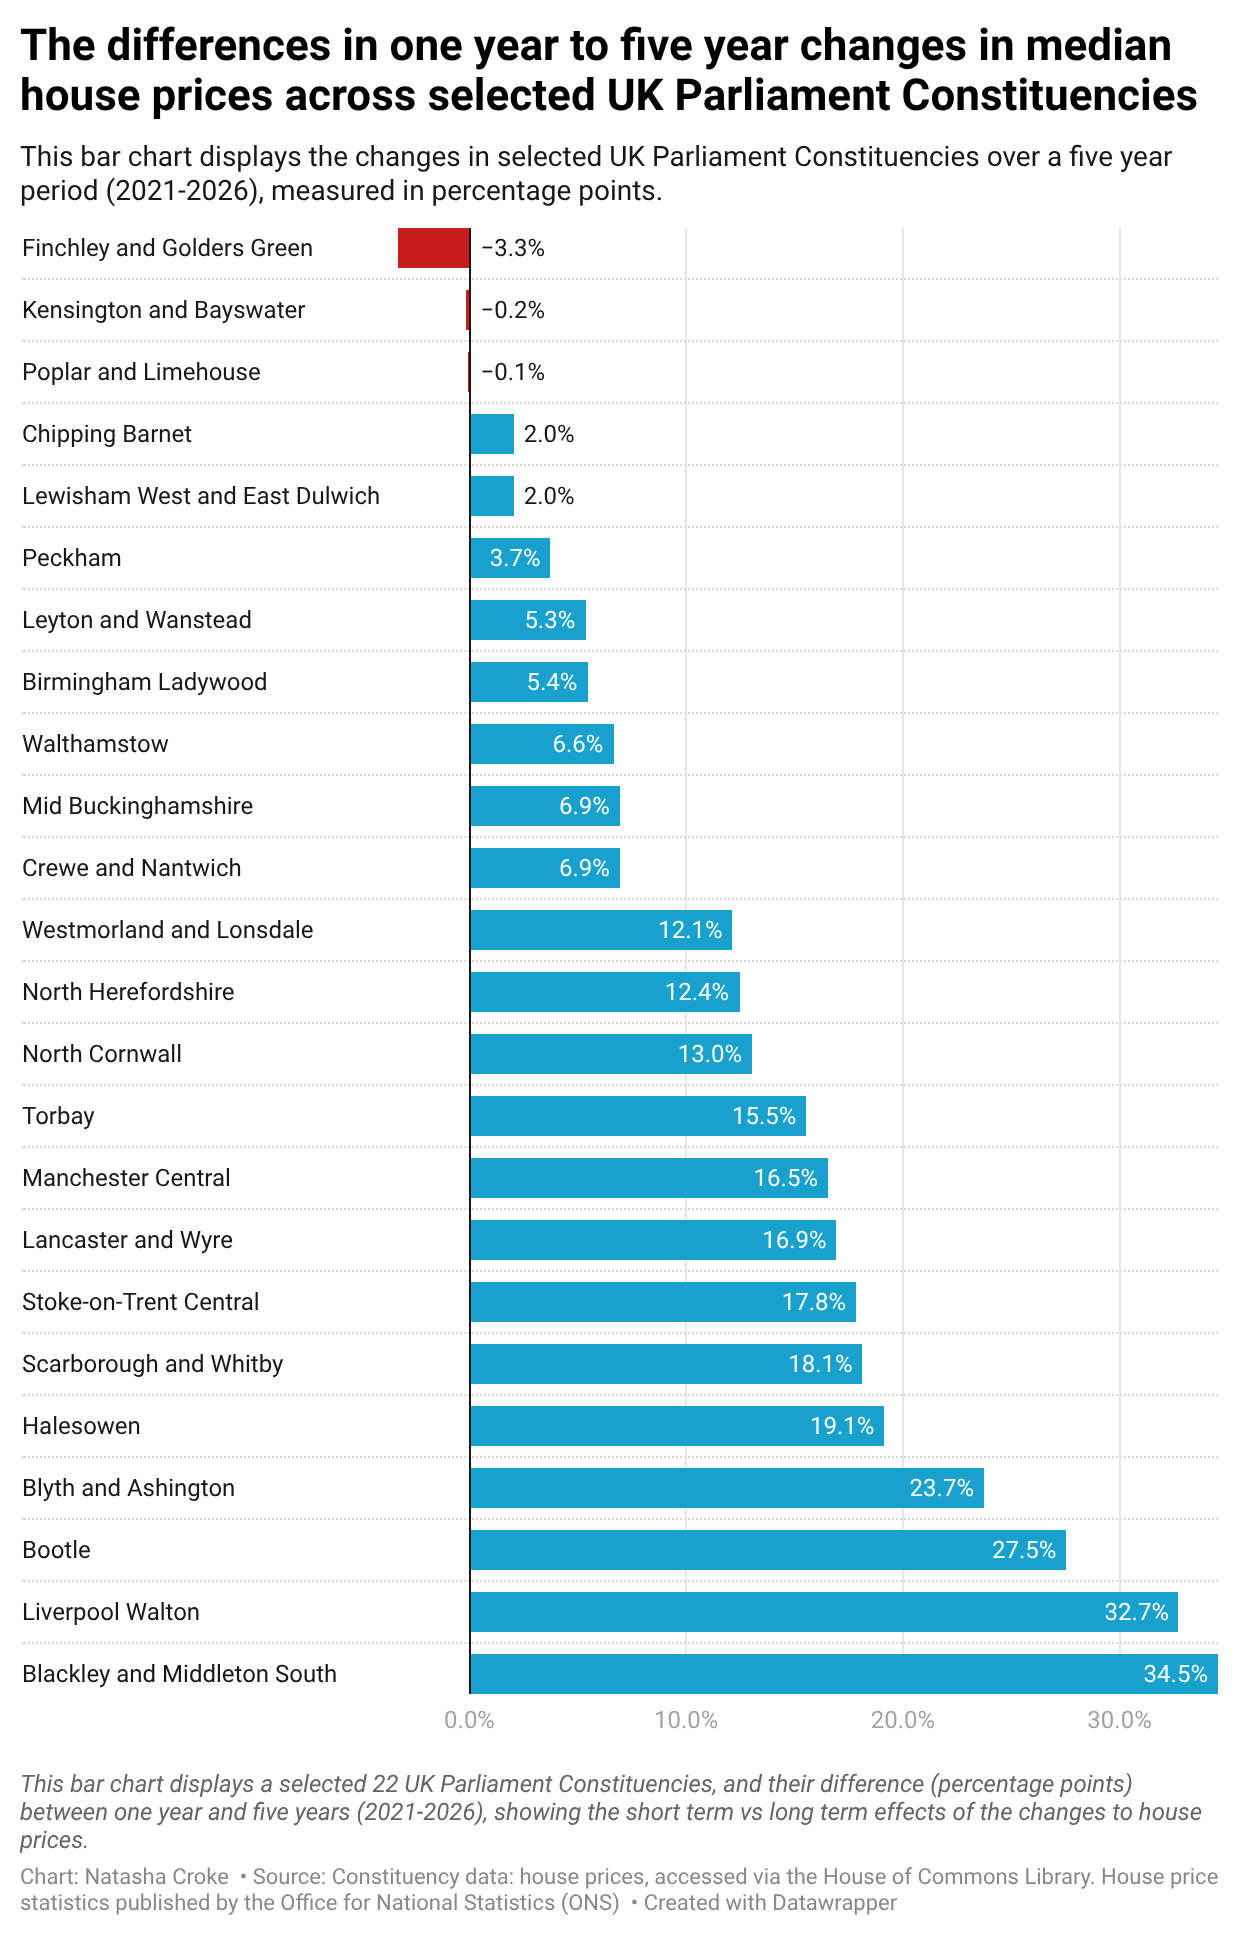
This is where there is a visible depiction of which regions face issues regarding changes in house prices, and whether these issues are short-term or long-term. Some UK Constituencies have faced fluctuations, both negatively or positively, and some have stayed consistent across both of these periods.
It is clear that the Northwest, long-term, has experienced a higher growth over the five-year period, despite some 2026 figures dropping. The most interesting change in the housing market is Manchester Central. The 2026 figures show a staggering -13.8% drop, while the five-year change is +2.7%, a difference of 16.5%. This shows how easy it is to conceal changes, especially in this instance of such a substantial drop in 2026.
Another interesting region is Greater London. We can see how contrasting the different constituencies in this region act and how divided the house market here is. Finchley and Golders Green for example, had a -3.3% difference between the annual and the five years, having a higher growth in 2026 of 10.5%, from having 7.2% over five years. Areas such as Peckham and (+3.7%) and Walthamstow (+6.6%) show an increase in difference over the five years. Kensington and Bayswater have also experienced very little change in figures (-0.2%). Yes, this makes housing market unpredictable for buyers, but what else does it mean?
Sandra Meredith, a resident of Bromley for almost 60 years, recalls what life was like previously when purchasing a house. She states, ‘my partner and I paid £5,500 for our three-bedroom chalet bungalow back in 1967. We had to save £1,000 for the deposit before we could get a mortgage’. The typical price of a three-bedroom house in this area, now goes for around £750,000, meaning this is around more than 136 times the price of what it initially went for, a shocking difference.
She continues, ‘Bromley is still an expensive Borough to live in regarding rents and rates. House prices are good if you are selling, but the housing market has slowed down a lot because people can’t get a mortgage, so people are extending rather than move’. Initially, rising house prices may seem beneficial for the area, and for homeowners looking to sell. However, affordability for new buyers has become a massive issue. Therefore, while constituencies are facing raises in property values, the housing market is inevitably slowing down. Affordability is restricting the level of movement, and the prices are just unattainable for many people.
Is the cost-of-living crisis relevant here?
According to The House of Commons Library, 55% of adults in Great Britain reported an increase in their cost of living, compared with the previous month. With everyday expenses becoming that much more of a hassle and a stretch of the pocket, it isn’t attainable for families to be thinking about moving, maintaining and managing mortgage repayments. According to The Bank of England, higher mortgage rates, inflation and cost of living make it harder for mortgagors to afford their repayments. The lack of disposable income in households means the idea of a new home isn’t in the budget.
Houses are getting more expensive, but the cost of living is too, meaning the public can’t keep up with the demands.
So, what’s the general idea? It’s evident that the UK house market is not moving in one direction, in fact, it’s all over the place.
While in broader regions, it may look like a clearer picture. Having an insight into how each of the constituencies are changing, both short-term and long-term demonstrates how uncertain the housing market can be for buyers. The ever-changing housing market is proved to be inconsistent, meaning a thriving 2026 may not mean an investment in that area is beneficial long-term. The cost-of-living crisis also plays an important part in the UK housing market. Certain areas come with higher demand, and therefore more costly prices. Initially, this seems to benefit house sellers, however, the inflation comes with affordability issues, especially in terms of paying off a mortgage. This means finally, thriving areas may not be in favour of its buyers.